Charts
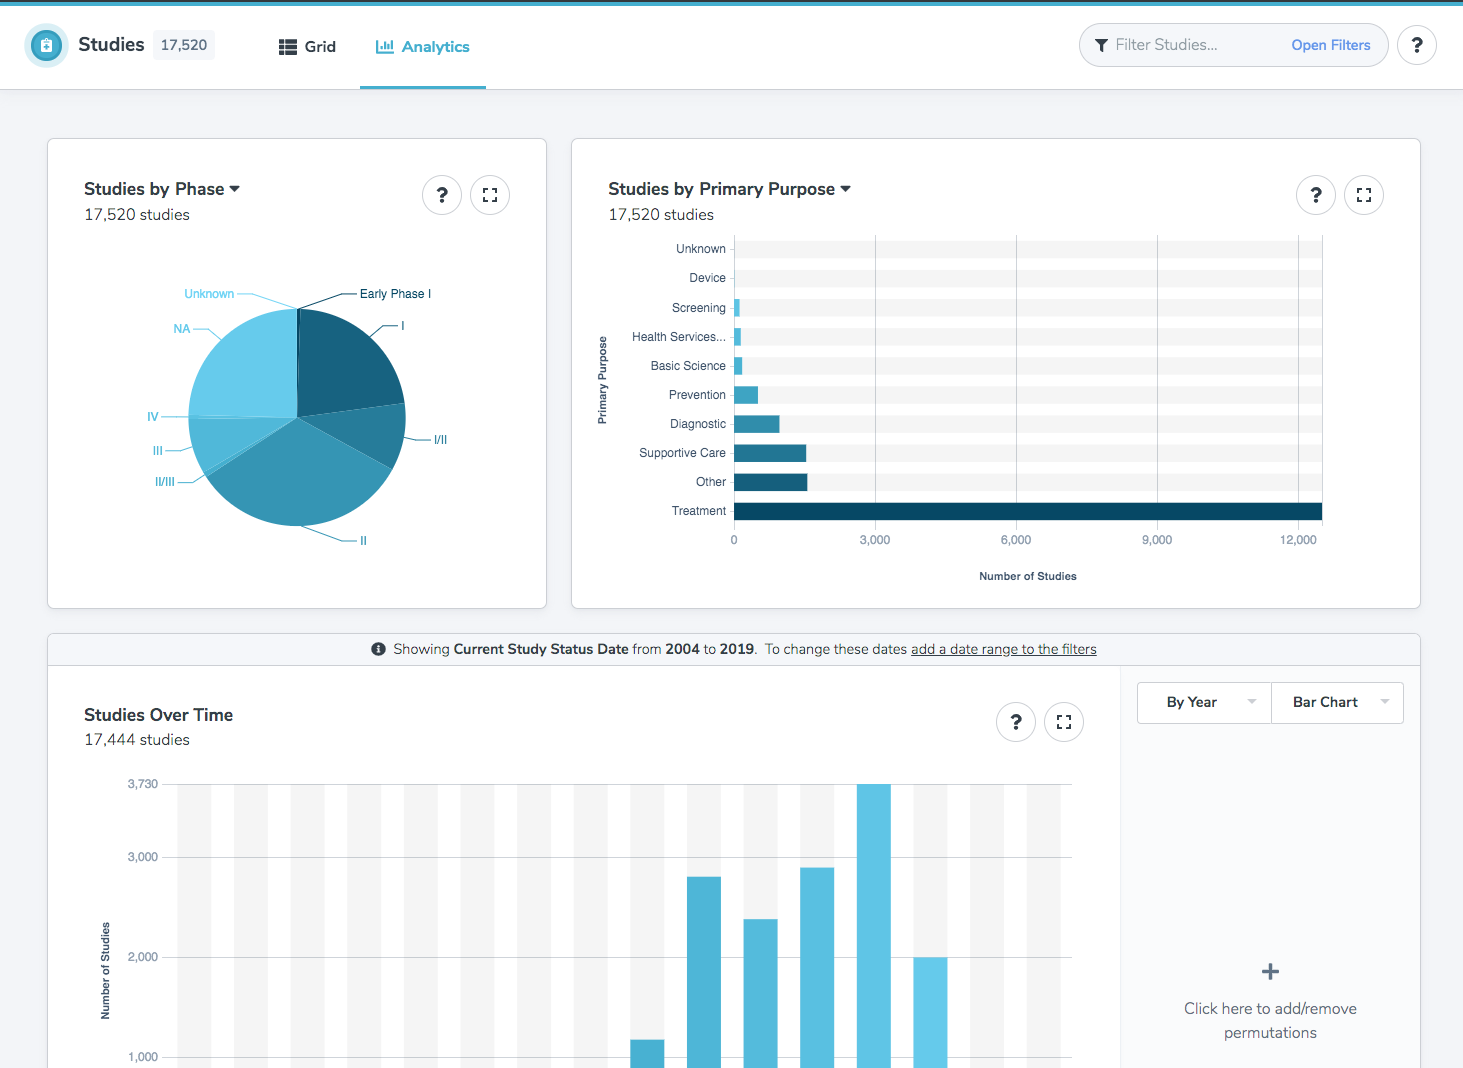
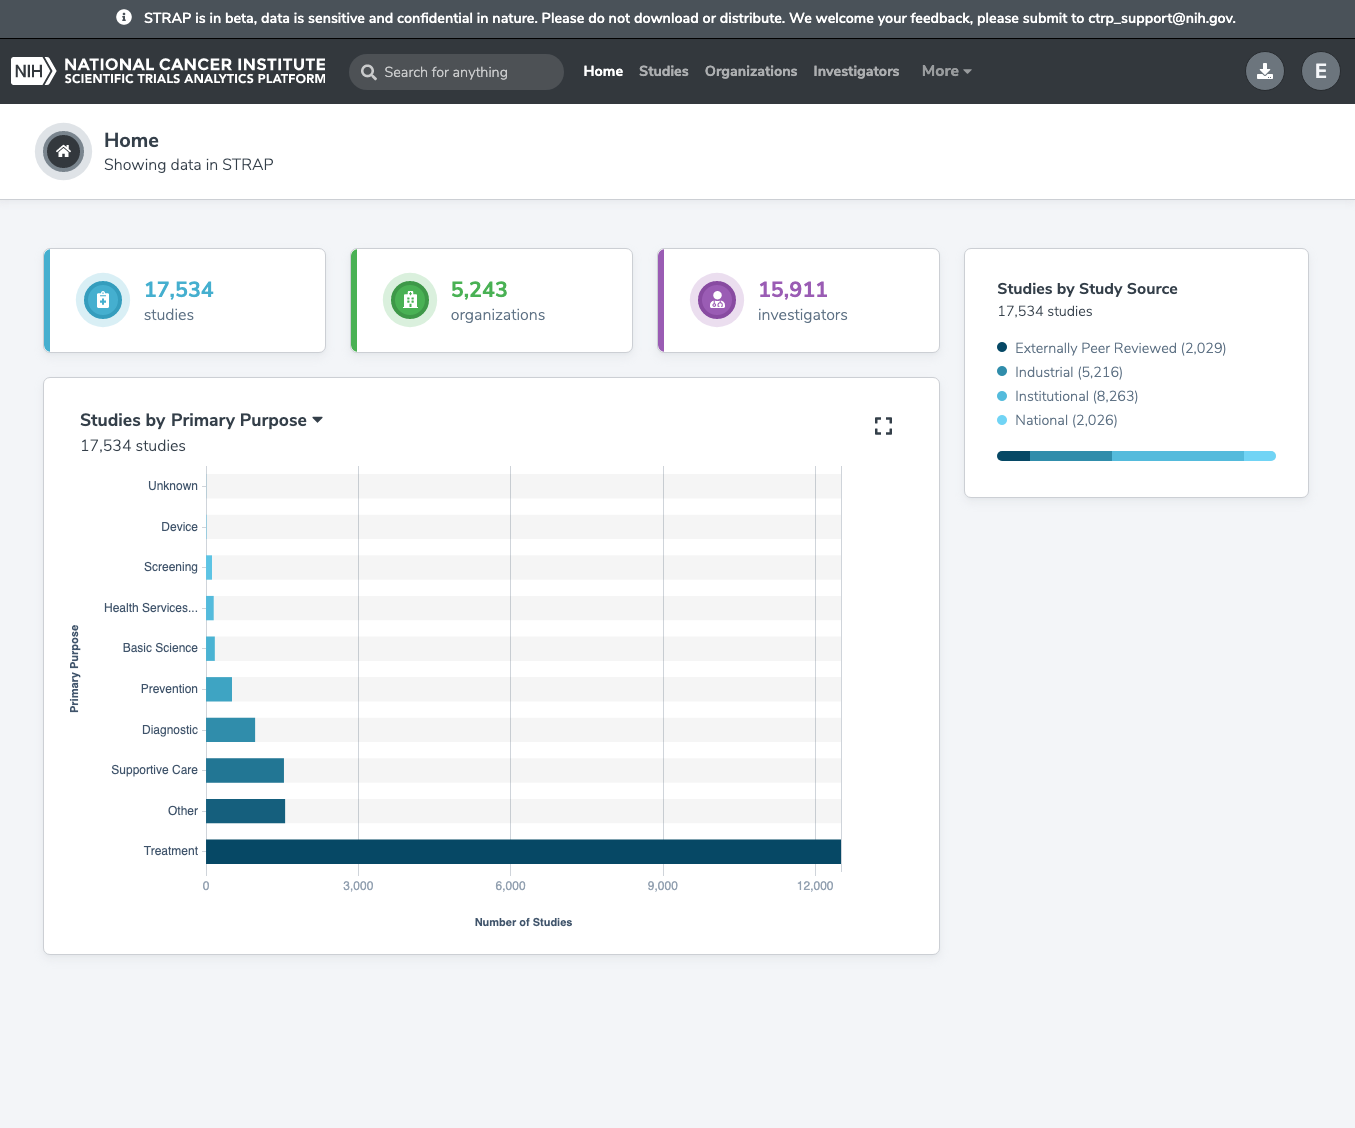
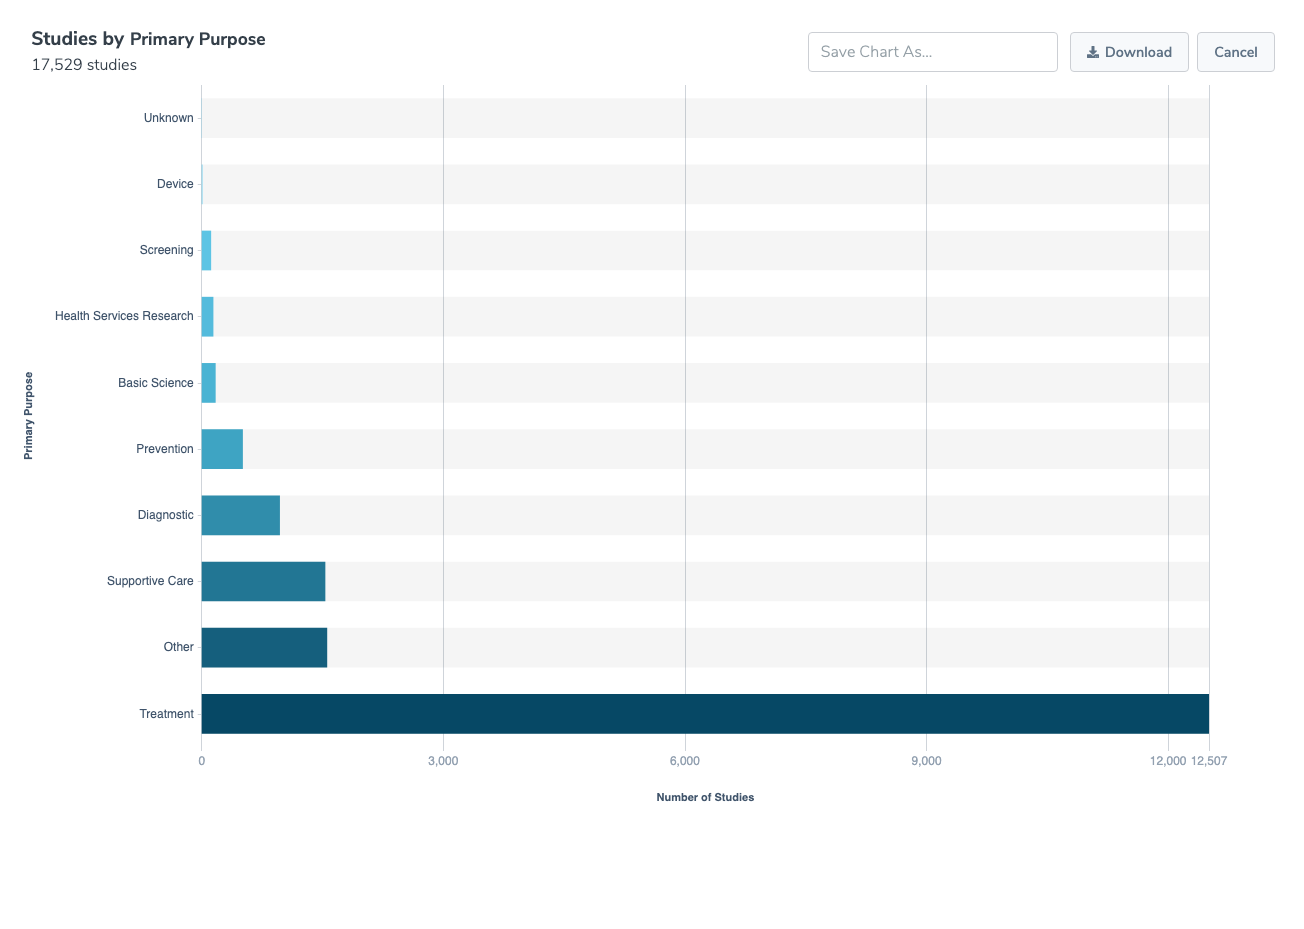
STRAP uses charts to visualize data. The most common chart seen in STRAP is the bar chart. Below is an example of the bar charts used in STRAP.
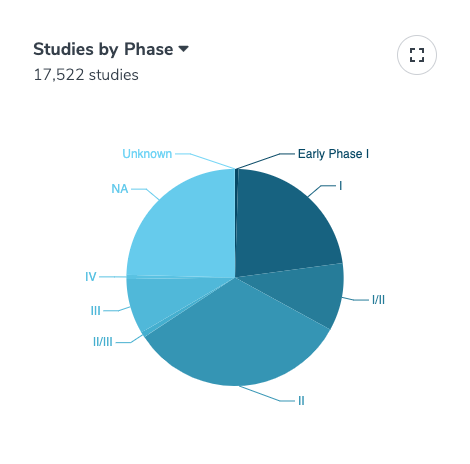
Though not present among the charts on the Dashboard, STRAP also uses line charts and pie charts for rendering data. Pie charts are present among the visualizations on Analytics tabs in the different pages.
Line Charts are an option in the Analytics for the results of using Date keyword criteria when running Filters on Studies. The functions and controls of this chart are similar to those for the other charts in the rest of the application.
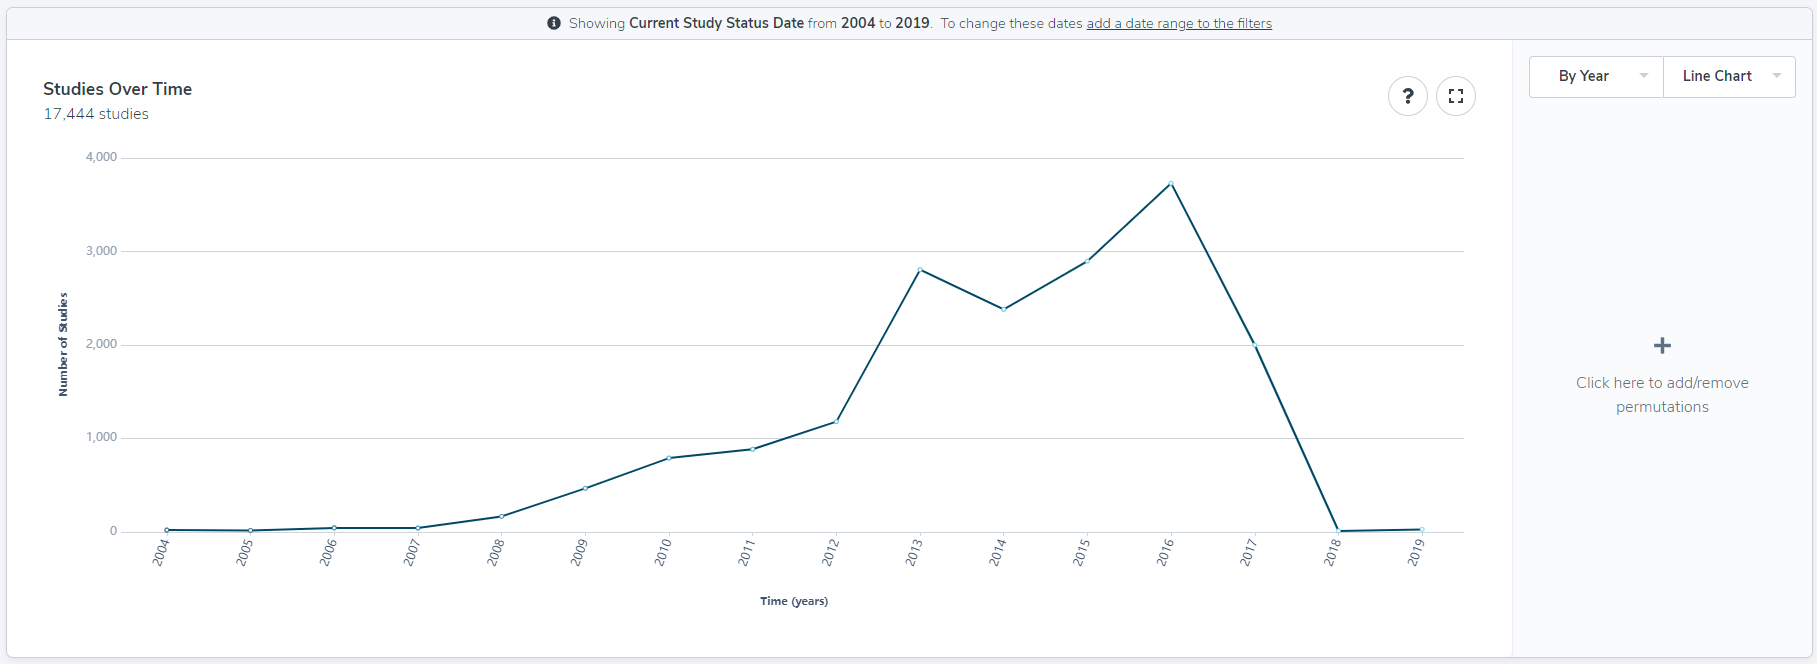
Chart Functions
There are some chart functions available for use. These functions include:
- Expand Chart to Fullscreen
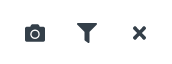
- Save as a Screenshot
- Show Search Summary
- View Data for Category
- Analytics Chart Filtering
Expand Chart to Fullscreen
The main dashboard shows multiple data visualizations together in the same screen.
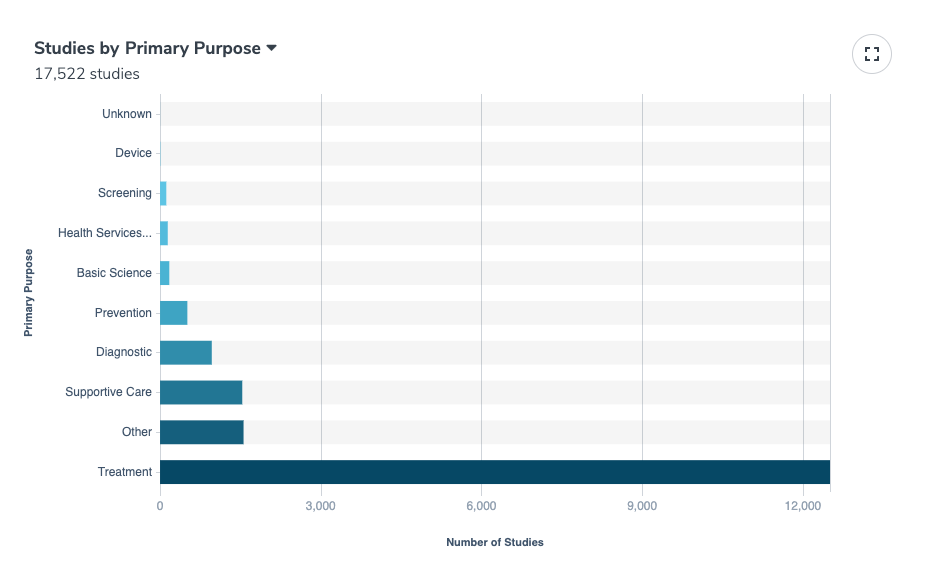
Clicking on the expand to fullscreen (opened square icon) button opens a fullscreen window and renders the chart in larger size, filling the window and allowing the chart to be seen in greater detail.

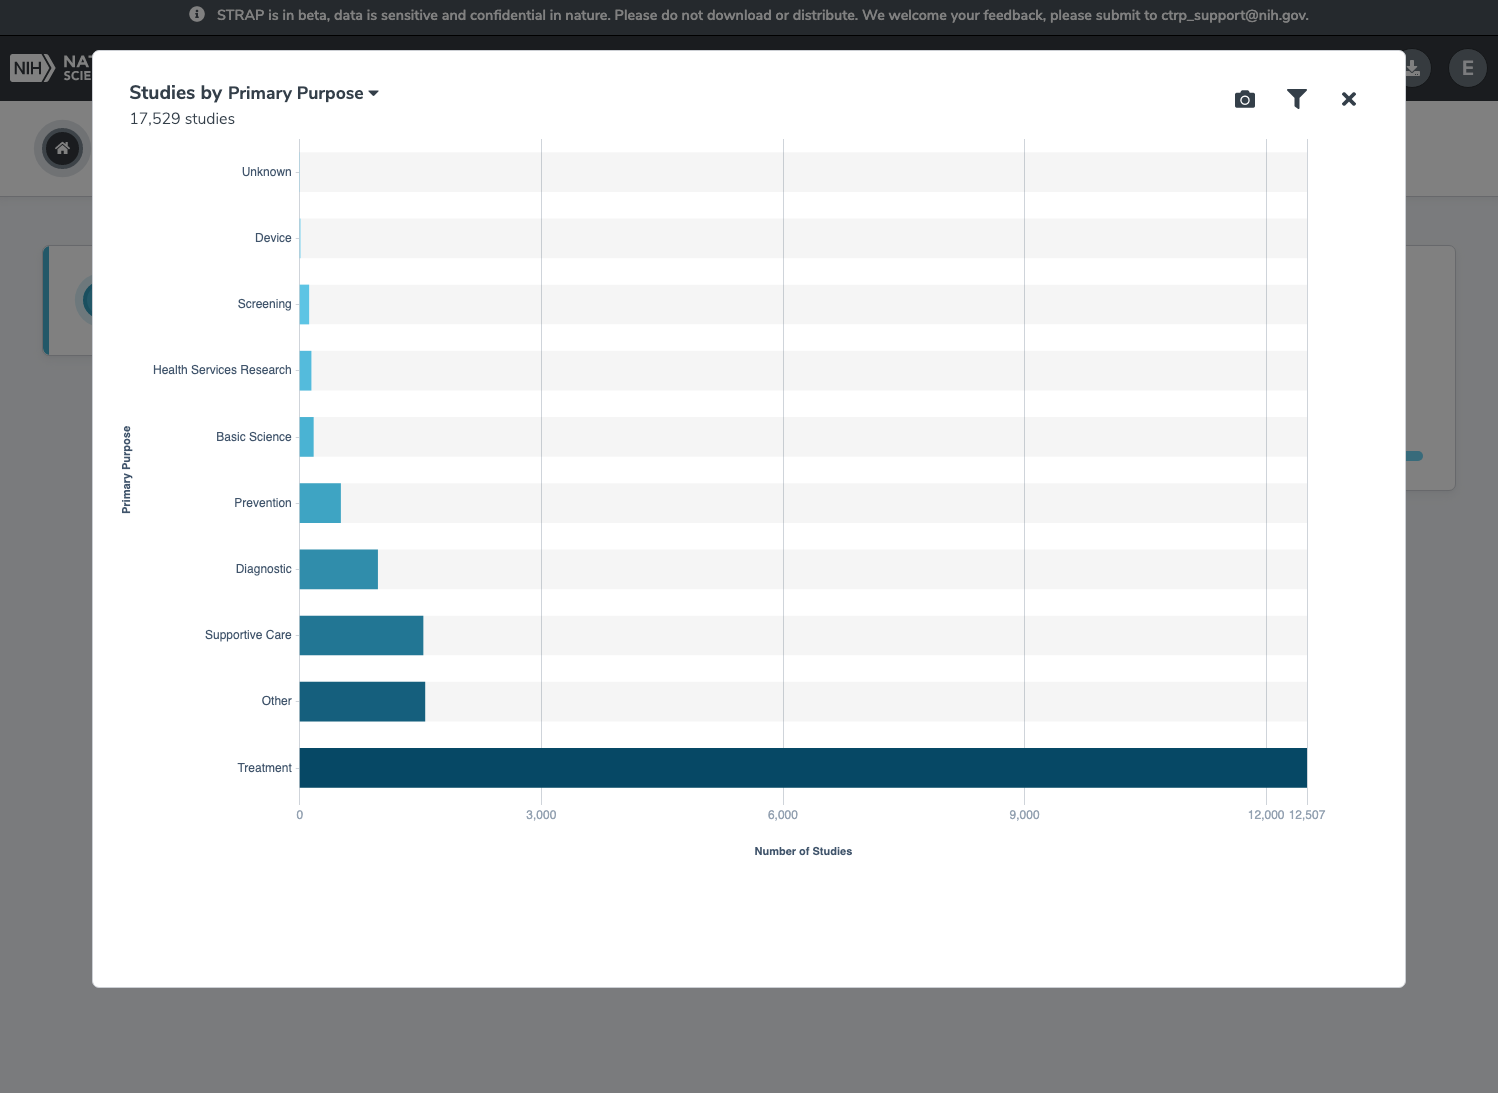
Clicking on the “X” icon in the right-hand corner closes the expansion window and returns to the dashboard view.
Save as a Screenshot
The functionality to save the chart as a screenshot (JPEG) is available from the fullscreen view. To save the chart, first click on the expand to fullscreen button at the upper-right corner of a chart. Next, click on the ‘Screenshot’ (camera icon) button in the upper-right corner of the window. Enter a name for the JPEG file in the textbox. Finally, click the ‘Download’ button to save the file. The file can be found in the ‘Downloads’ folder.
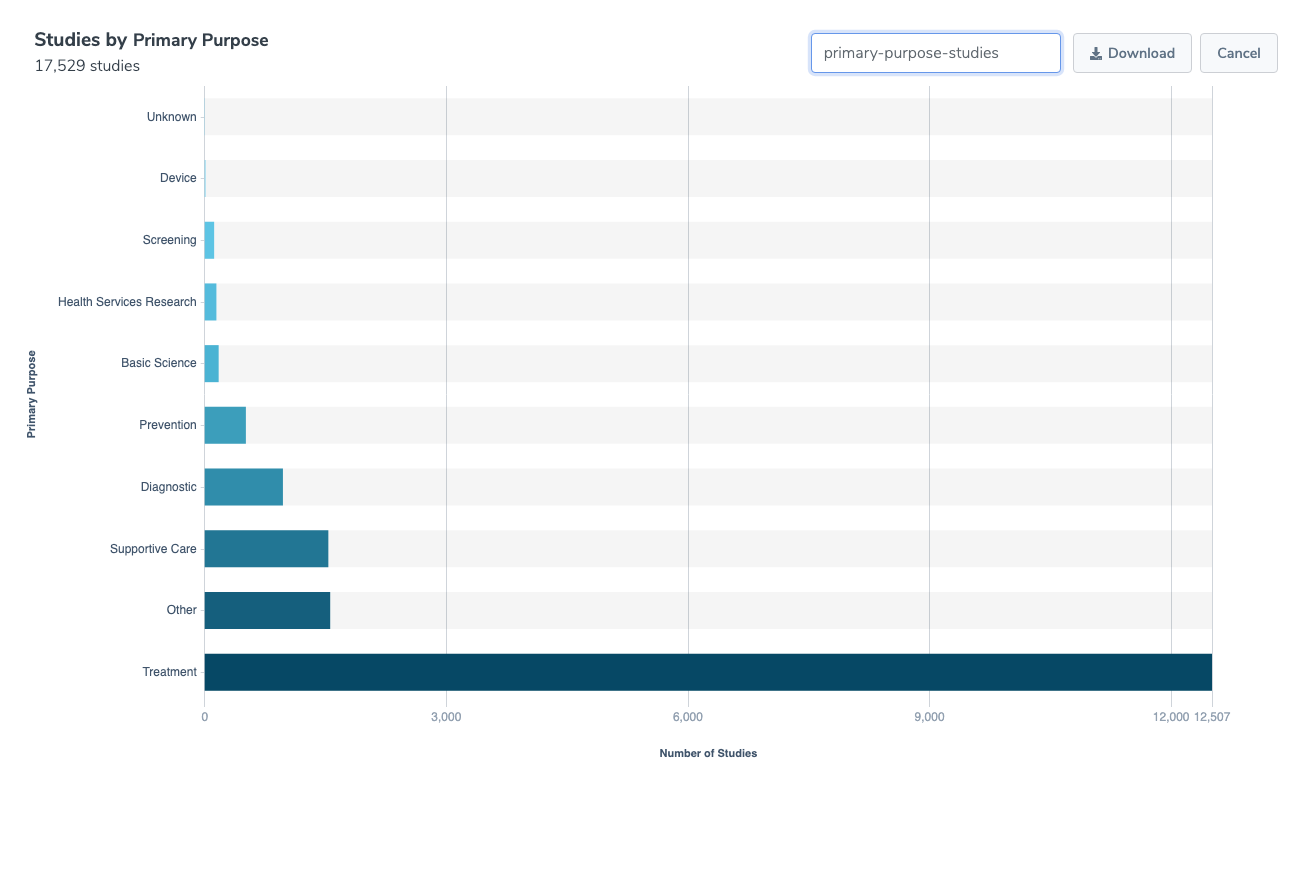

Clicking on the ‘Cancel’ button cancels the download and navigates back to the fullscreen view.
Show Search Summary
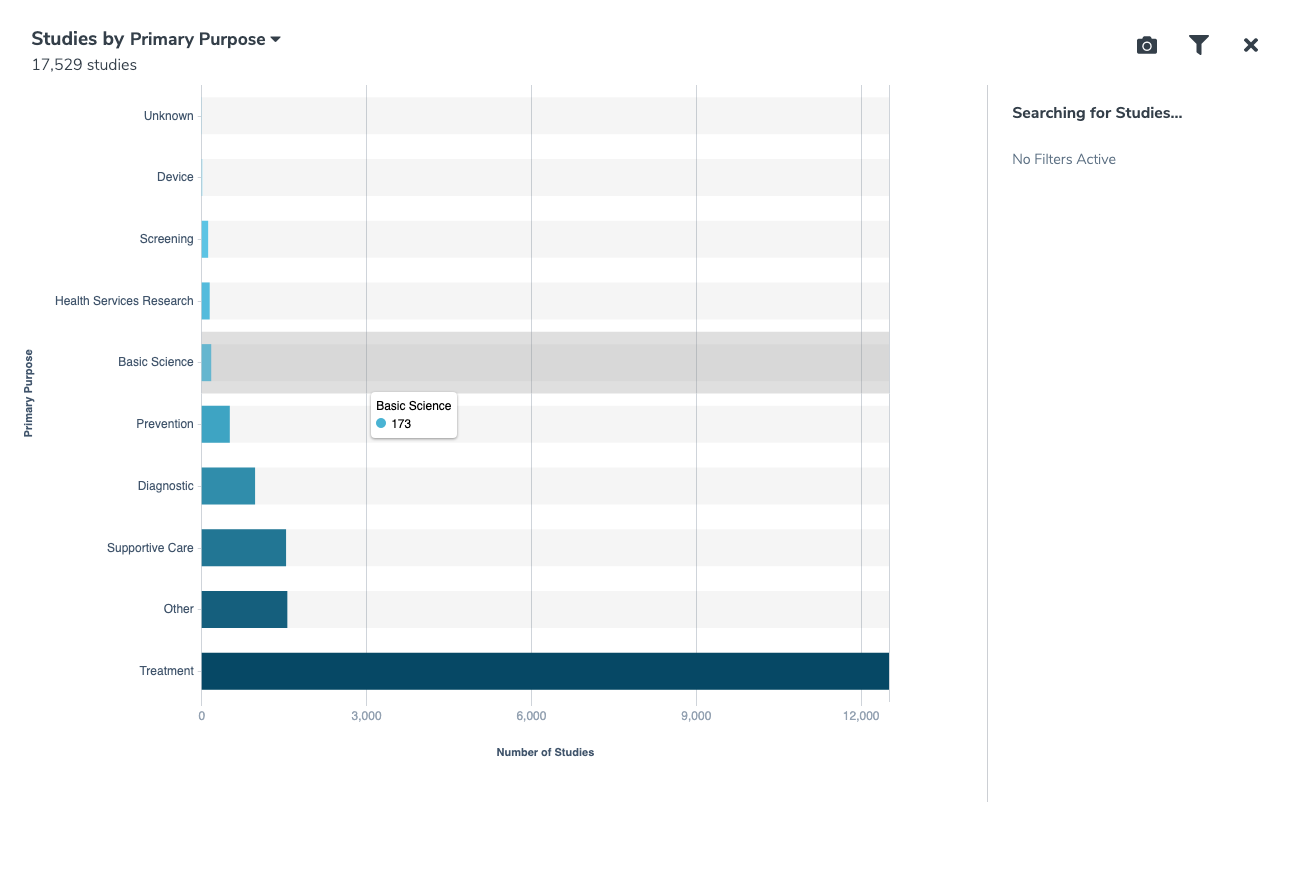
The functionality to show the search category for a chart is available from the fullscreen view. To show the search category, first click on the expand to fullscreen button at the upper-right corner of a chart. Next, click on the ‘Show Search Summary’ (funnel icon) button in the upper-right corner of the window.
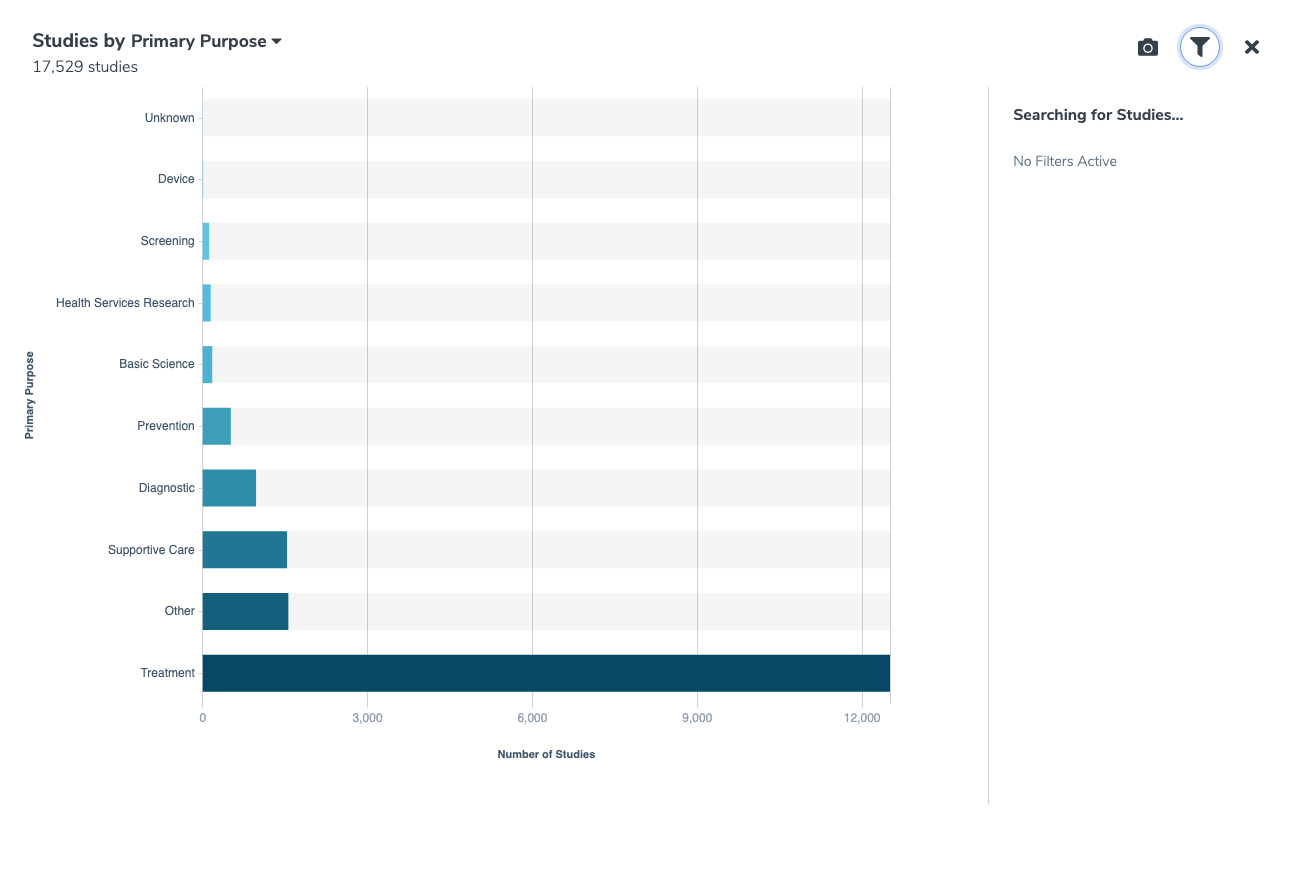
The search summary data will be displayed in the right-side pane of the window if the user role allows for search summary function.
View Data for Category
The same functionality for viewing a Data Grid for a selected chart category is available in the fullscreen view as well as from the Dashboard view.
Mouseover of the individual bars (or pie wedges) will activate a popup bubble listing specific details for that bar: label and count.
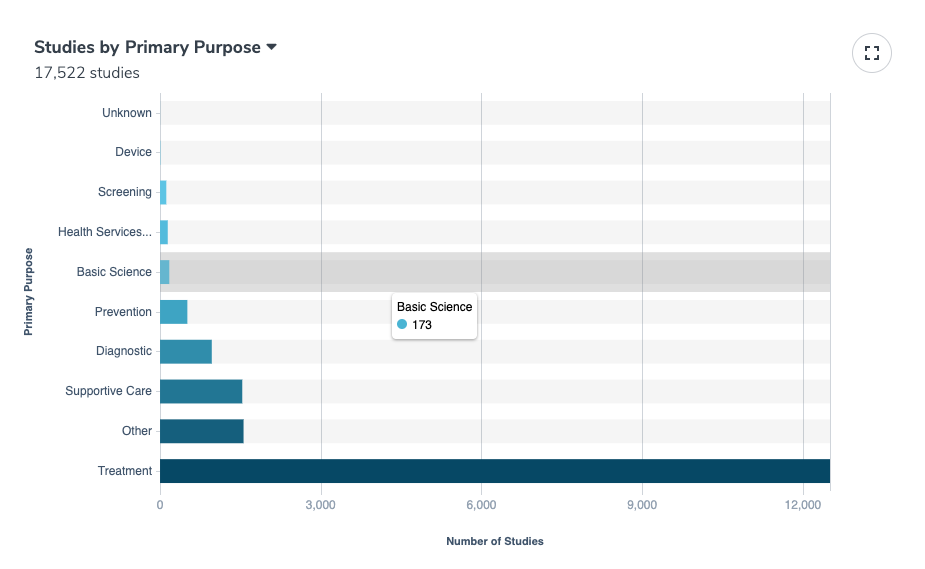
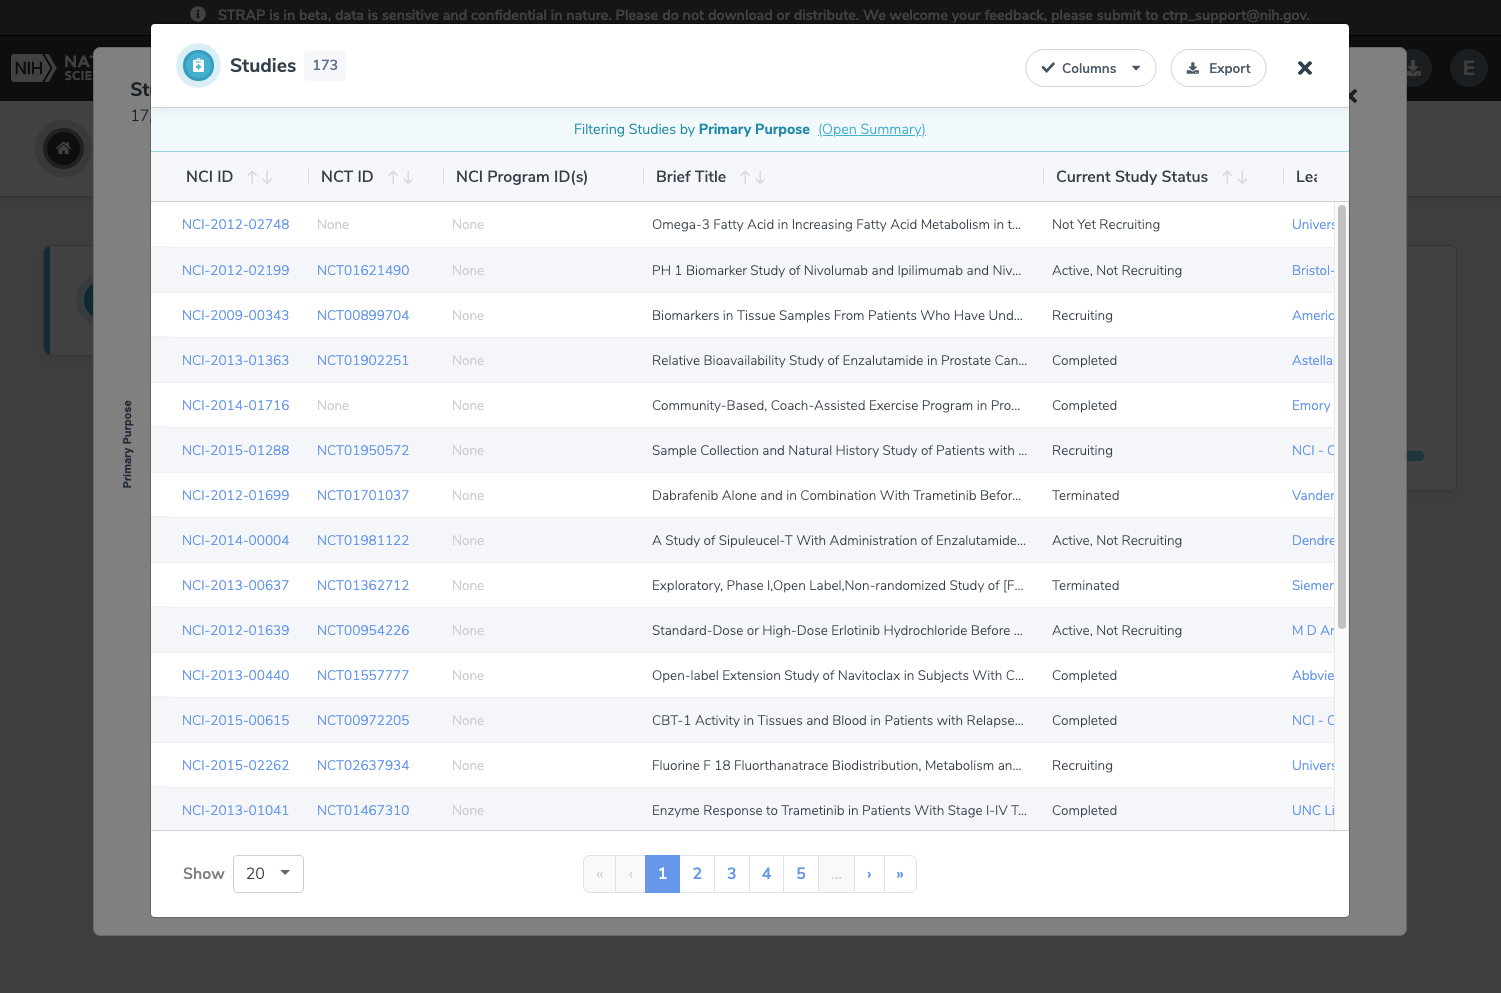
To view the Data Grid for a category from the fullscreen window, click on a section (bar, pie piece, etc.) of the expanded chart. Clicking on a bar (or wedge) will activate a popup window with a Data Grid of the records for that category.
Analytics Chart Filtering
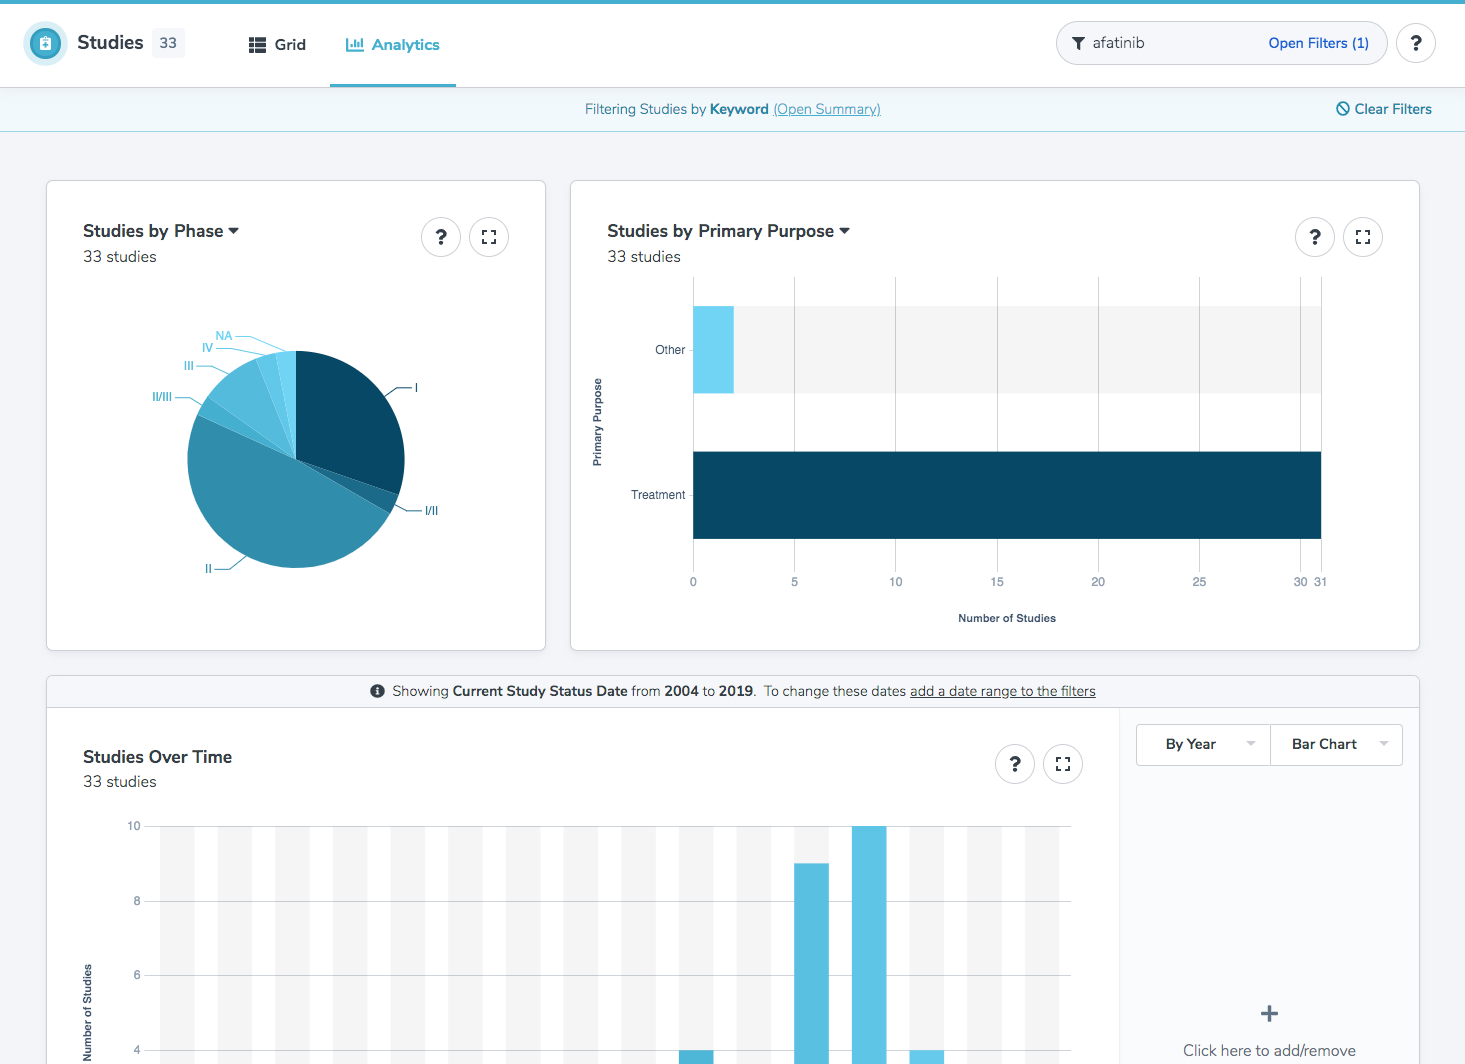
Chart filtering is available for charts on the Analytics tab of the Studies landing page. When the Analytics tab is active, the “Filter Studies” search widget can be used to filter the charts according to specific criteria.
The search widget allows the user to filter the studies according to a keyword entered in the textbox or click on “Open Filters” and display the Filter Studies window. Please see the section Studies: Filters for further details.