Home
> STRAP Pages > Studies
> Data Grid & Analytics
Studies: Data Grid
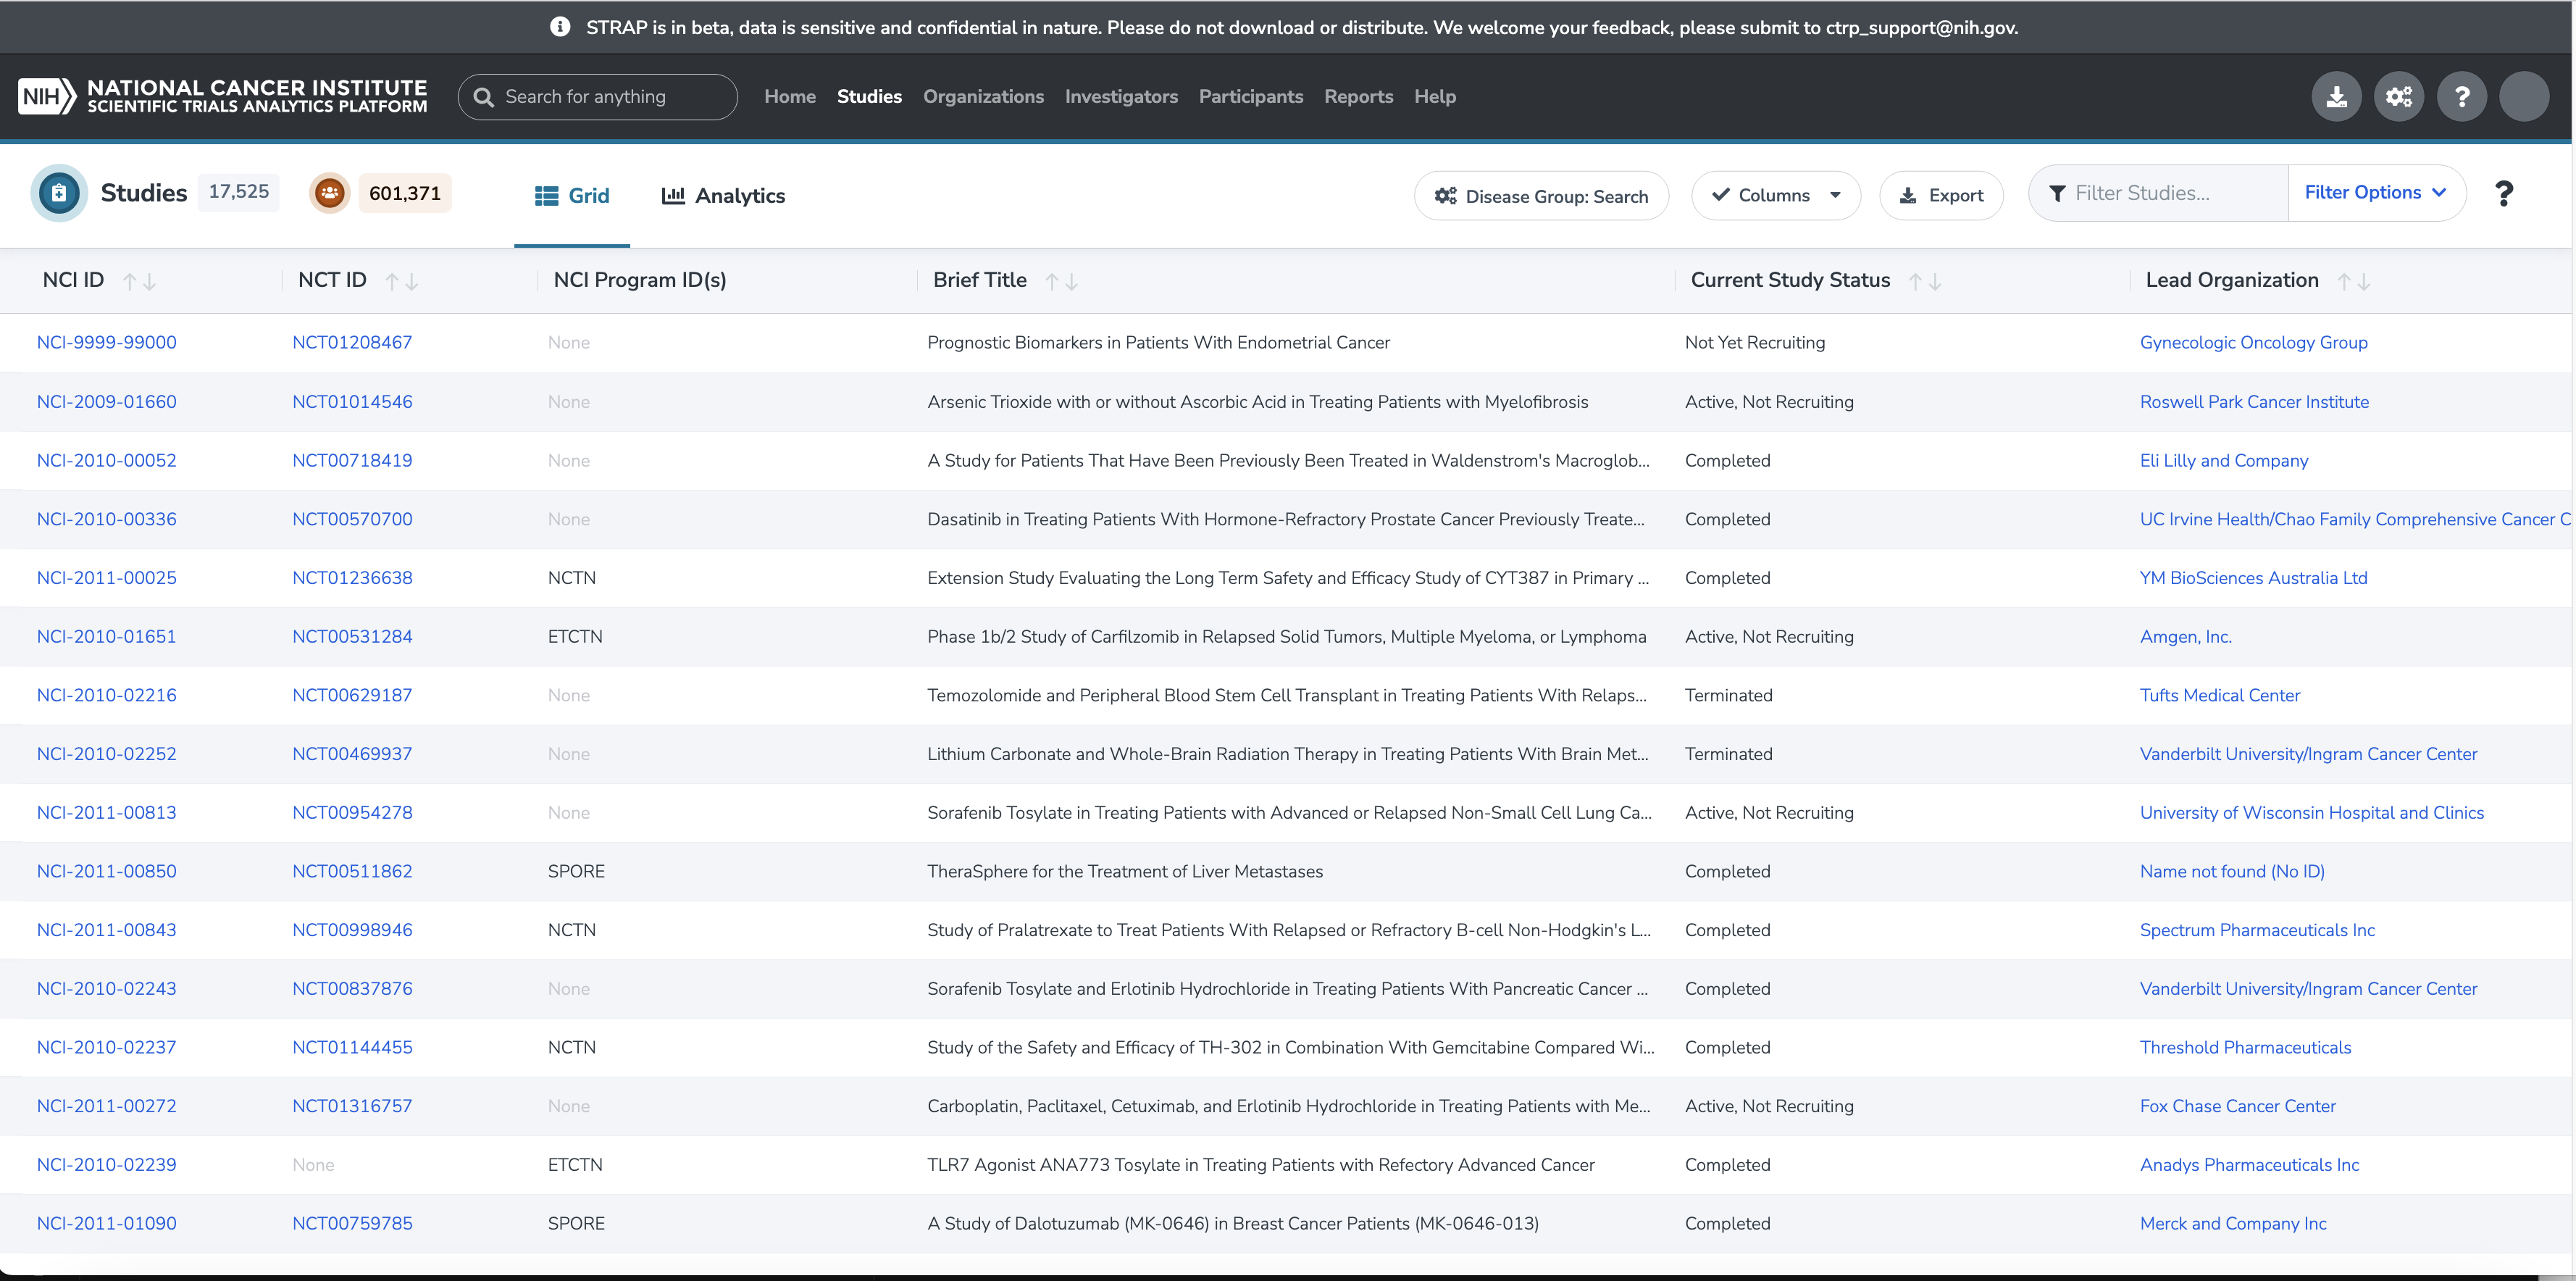
Clicking on ‘Studies’ in the navbar brings the user to the Studies Data Grid. This page has two tabs, ‘Grid’ and ‘Analytics’, as well as several controls. The default view is the data grid.
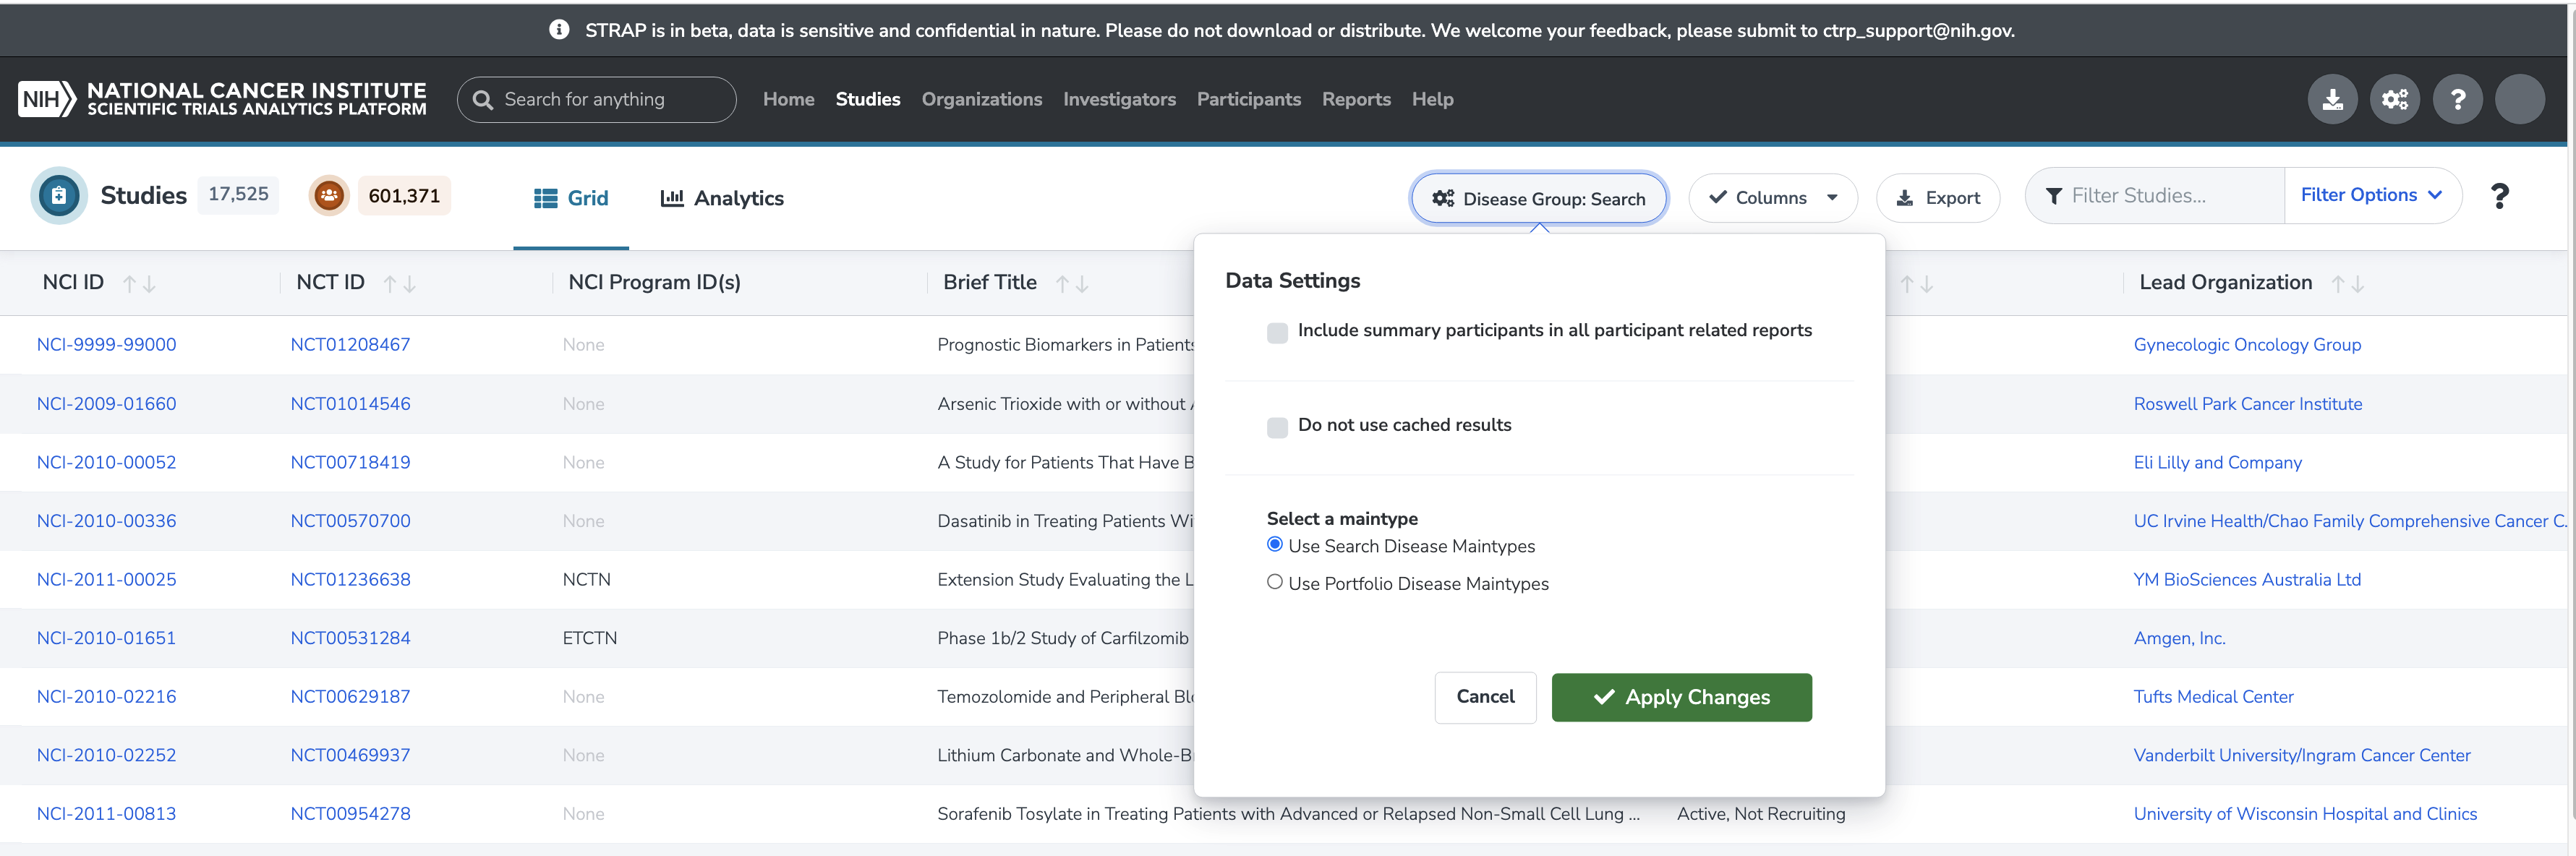
Disease Group indicator will be shown to display the current disease group selection in STRAP: Search or Portfolio. Users are able to click into the indicator to trigger the data setting to modify the disease group selection.
Studies: Analytics
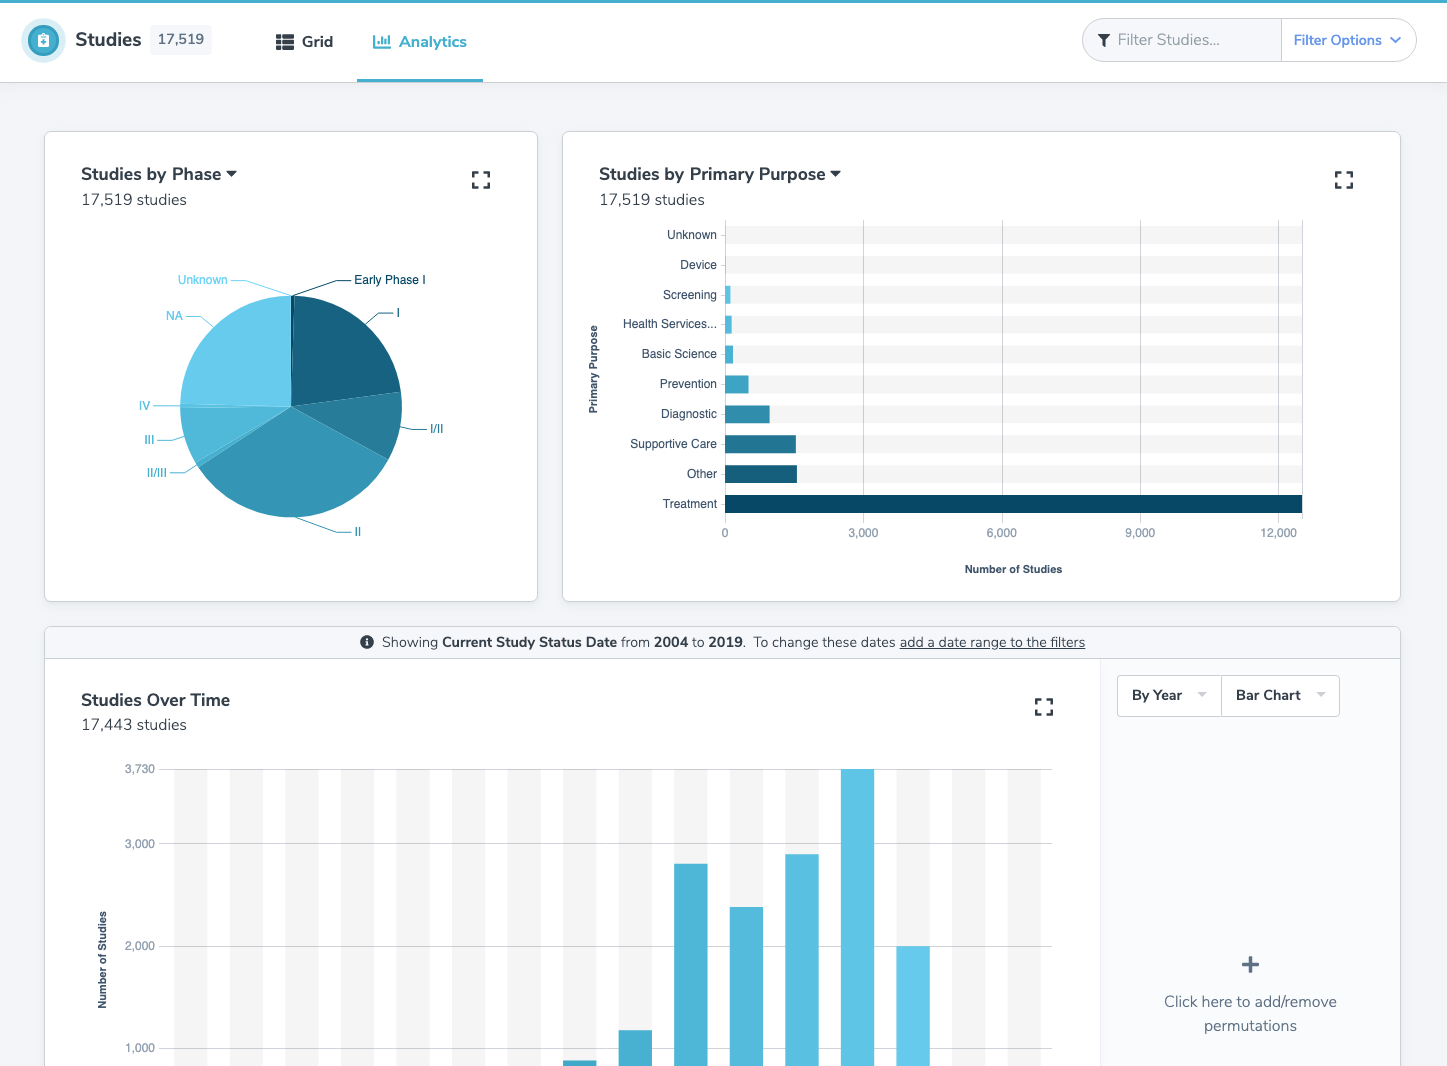
Clicking on the ‘Analytics’ tab shows the view containing a number of charts.