Home Dashboard
The Home page contains a Dashboard with statistics boxes for studies, organizations, and investigators as well as several charts.
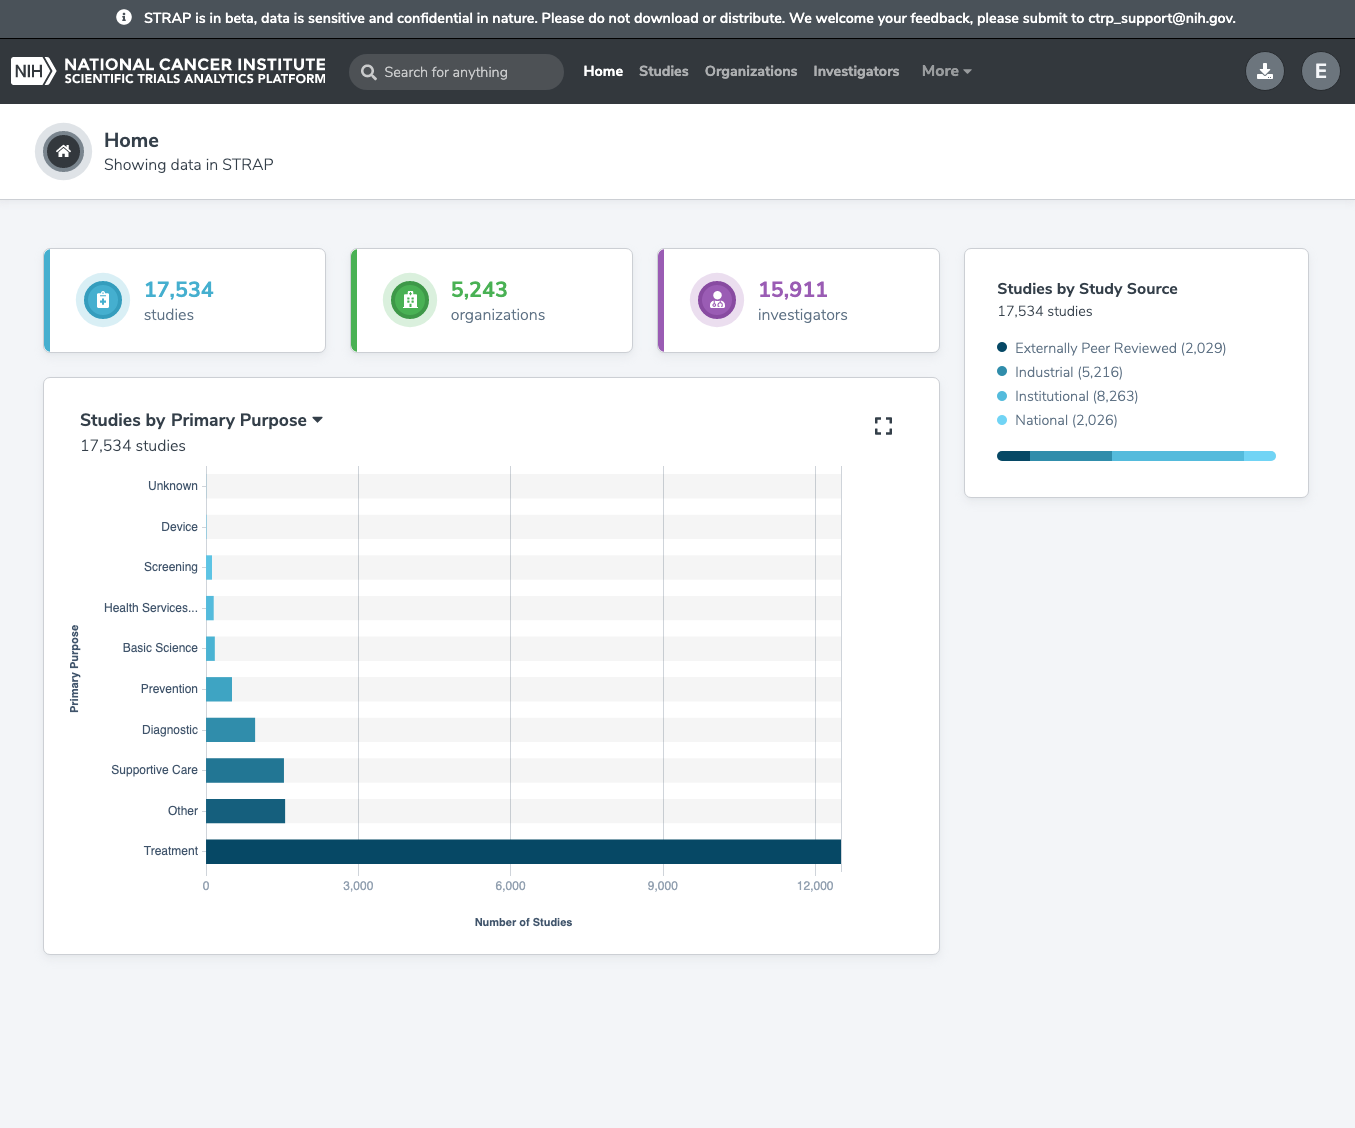
The Home page also has a Search widget, as well as a button to see user details (circle with initial inside) and a button to access files available for download (circle with down-arrow icon inside).)


Dashboard Charts
The charts on the Dashboard are:
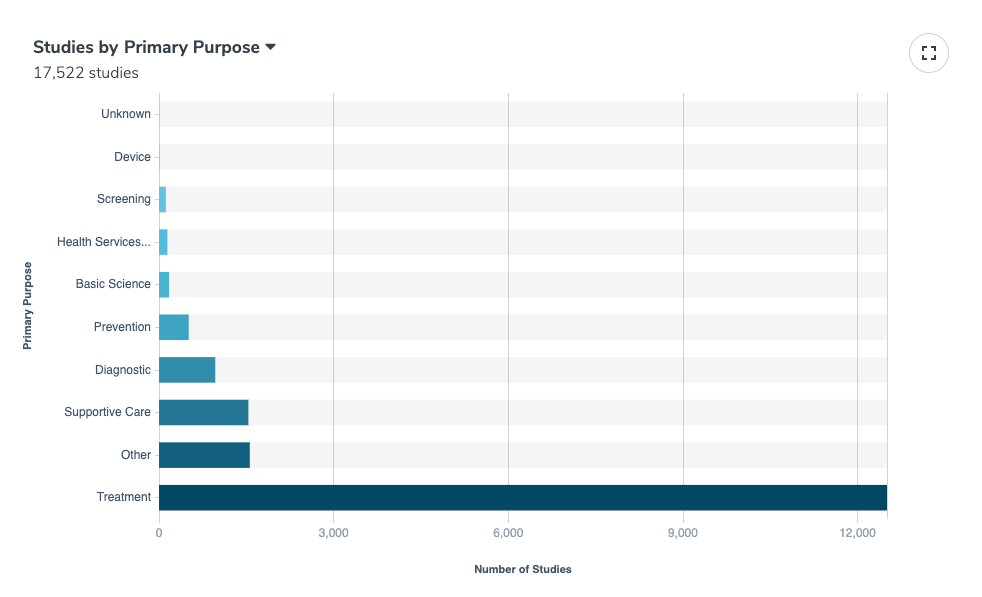
Studies by Primary Purpose/Current Study Status/Phase
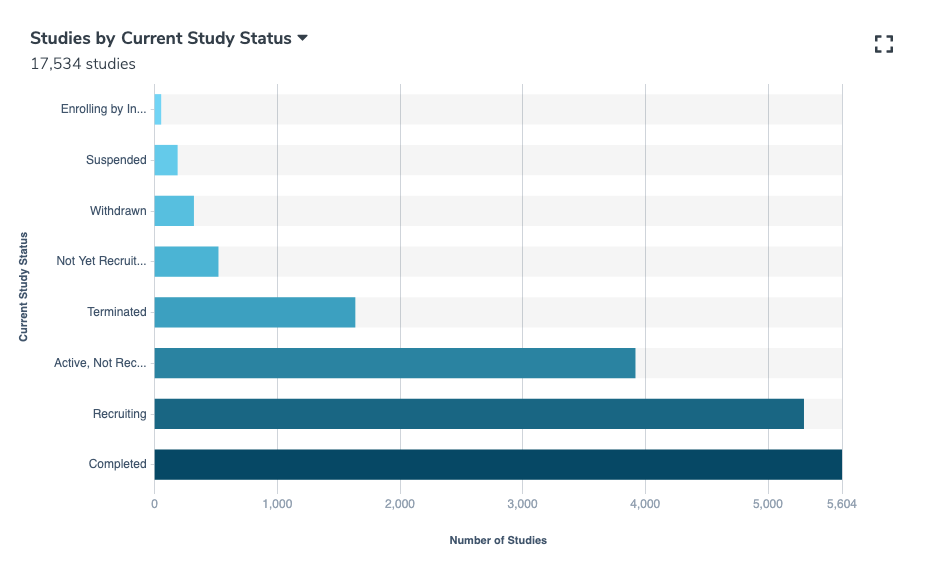
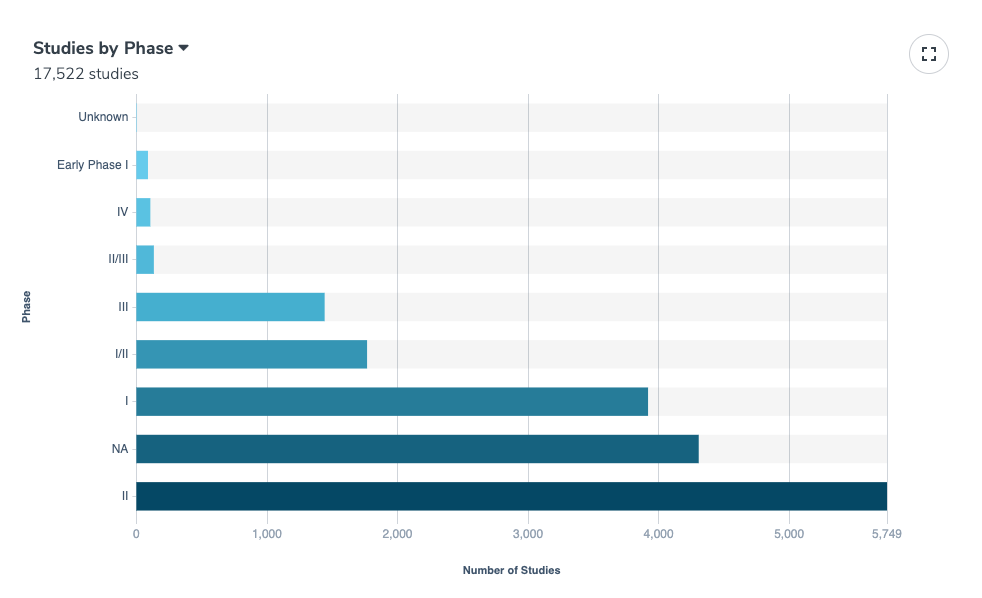
The user can click on the drop-down arrow next to the title in the top left corner and can choose between three different charts: Primary Purpose, Current Study Staus, and Phase.
The Studies by Primary Purpose chart is a horizontal bar chart displaying the number of studies categorized by the studies’ purpose.
The Studies by Current Study Status chart is a horizontal bar chart displaying the number of studies in each of the different possible study statuses.
The Studies by Phase chart is a horizontal bar chart displaying the number of studies categorized by which phase the study is currently in. See the Glossary for definitions of each phase.
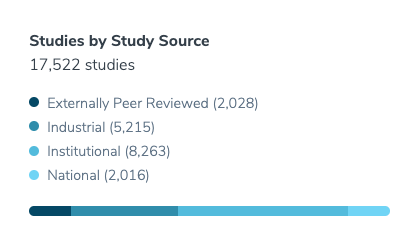
Studies by Study Source
This chart lists the totals of each type of study source and includes a horizontal stacked bar chart at the bottom of the window.